Day One: Tak Kenal, Maka Tak Sayang
As the heading above, an introduction was the main agenda on the first day of the Elective Health Alliances Science Program (EHASP) course week (03-08-2022). My chosen course was entitled Data Science and Big Data for Public Health. This has indeed become a culture, especially at the Faculty of Medicine, Padjadjaran University.
We, the students, got to know each other, followed by an introduction to the supervisors, which are dr. Dwi Agustian, MPH, Ph.D., dr. Budi Sujatmiko, M. Epid., and dr. Mulya Nurmansyah Adisasmita, M.T. After that, we were asked by the supervisors to tell the reasons or motivations for choosing the data science EHASP course, which is not quite related to the medical field, especially in terms of basic science. In response to the question, I gave several answers, which are:
- a description of the course explaining that this course is intended for beginners in terms of data science. So, it convinced me to be able to follow and understand the material on this course;
- my interest in computational things, including data science or data analysis; and
- most of the activities of the course are likely to be done online while I wasn’t around the campus area.
After the introduction is over, dr. Dwi or often called dr. Yayan as the main supervisor, explained a glimpse of this EHASP course, especially regarding activity schedules, learning methods, and assessments.
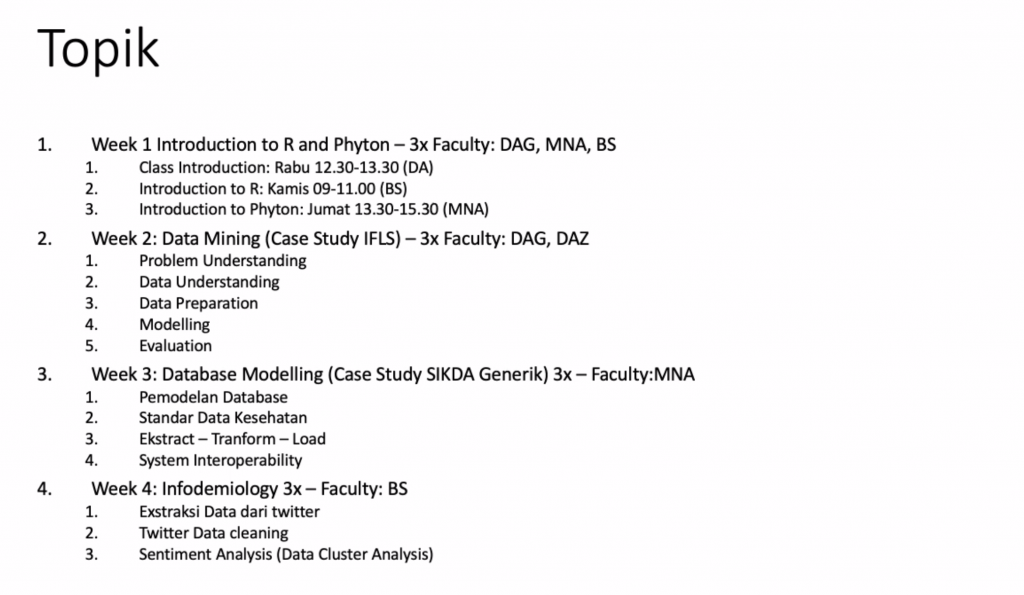
When looking at the topic and the schedule of activities that will be carried out for the next 4 weeks (Figure 1), I personally quite felt shocked and became worried because many things felt unfamiliar regarding the topic, such as data mining, database modeling, and data understanding.
Honestly, I’ve never learned those things, either by myself or by taking paid or free courses/classes. However, after going through several learning materials in this first week, I felt grateful because I’m quite confident to be able to understand all the learning materials in this EHASP course. In addition, dr. Yayan has also prepared a paid learning platform called DataCamp (Figure 2). Therefore, by following this EHASP course, I hope to be able to develop an innovative idea related to data science, especially in the medical field.
Day Two: Introduction to R
On the next day (04-08-2022), we began to enter the learning material session. In this first session, we learned one of the basic things in the field of data science, which is the R presented by dr. Budi.
R is one of the programming languages that is widely used in analyzing data, especially related to statistical and graphical data analysis. With the R programming language, we can add and define new functions to data, especially those functions related to statistics and data visualization.
To make it easier when using R, we can use an application that is integrated with the R programming language, which is RStudio. Using RStudio, we can run R programs with a friendlier and easier-to-understand user interface (UI) design. For more details about R and RStudio, you can read here.
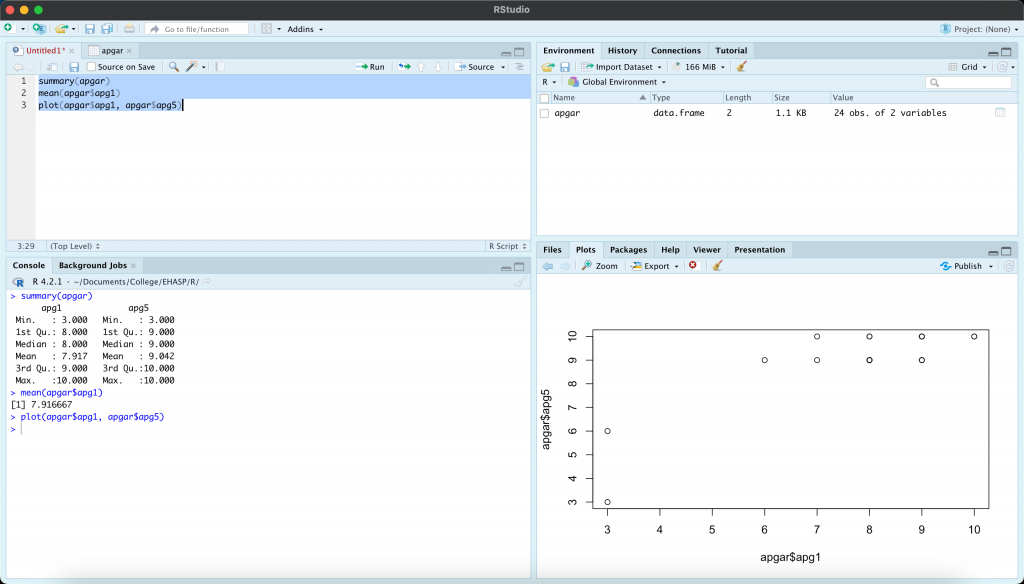
After an explanation about R and RStudio, dr. Budi did a simulation on how to operate R and RStudio directly in the Zoom Meeting room. He gave us an example of several functions that can be used to analyze data, such as the mean function to find the average of the data, a summary to summarize the statistical values of the data, and a plot function to visualize data.
I felt quite impressed when performing those functions (Figure 3) because it was kinda interesting and cool, although indeed things like these we can also do in other applications, such as Microsoft Excel. In addition, the process of compiling or executing R functions felt very fast. Hence, R is very useful for analyzing quite a lot of data or commonly referred to as big data.
Day Three: Introduction to Python
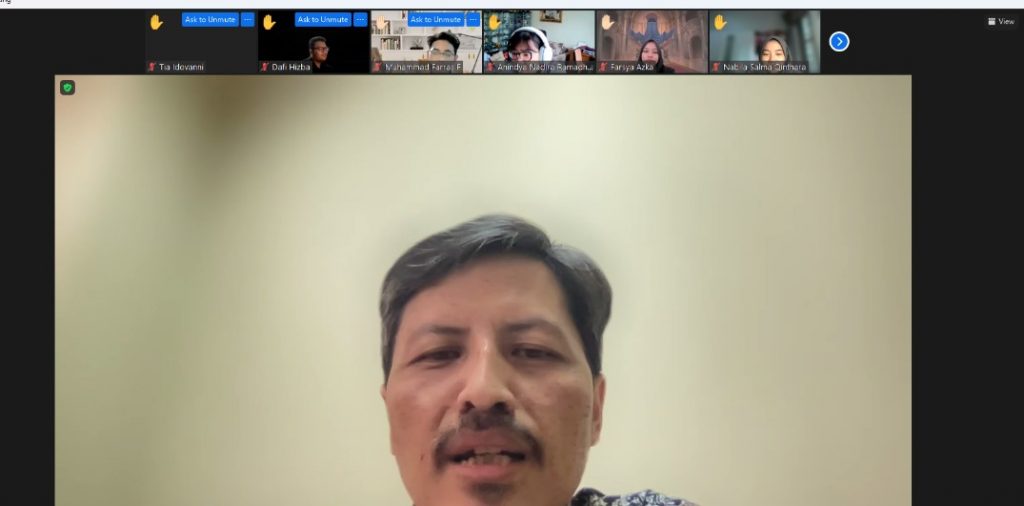
On the last day of the first week (05-08-2022), we learned the second material, which is Python presented by dr. Mulya. Python is the second programming language that we must learn because it’s also often used in analyzing statistical data.
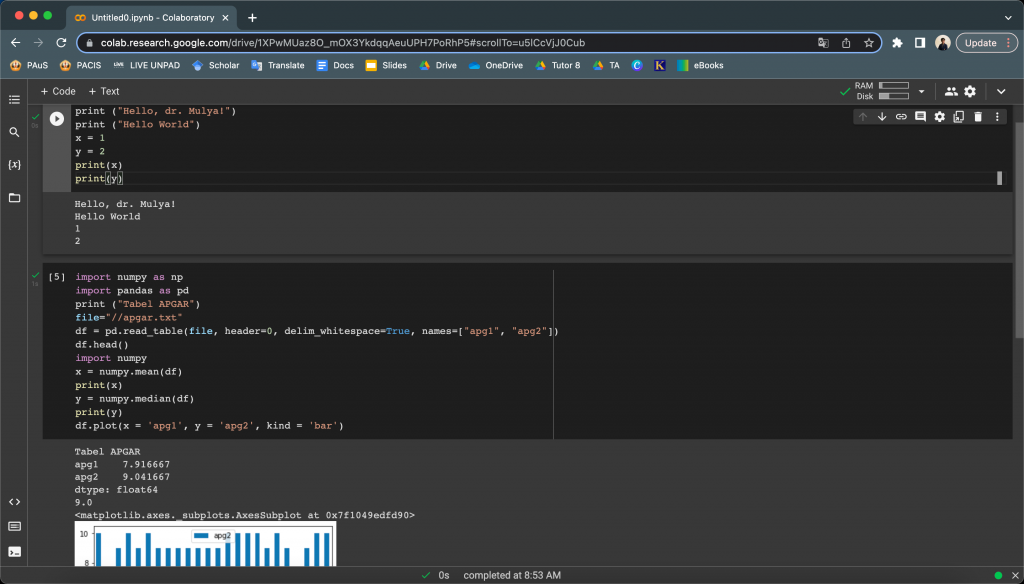
Just like the previous meeting, at first, dr. Mulya explained the theory of Python, starting from its definition, and functions, to its advantages and disadvantages. In general, Python is identical to R, but with slightly different functions. After a theoretical explanation, dr. Mulya did a simulation on how to use Python by using Google Colab. Figure 5 shows the results of my experiment using Python on Google Colab
Indeed, my impression of Python is slightly different from R in the previous meeting. I feel that Python is quite complicated when compared to R. For me, it’s easier to understand the syntax and functions of R compared to Python. However, it turned out that we will slightly more focus on R for the DataCamp project according to dr. Yayan.
At the end of the meeting, dr. Yayan divided us into 3 groups for using the DataCamp learning platform. I’m included in group 3 consisting of Farsya and Anin with dr. Budi as a supervising doctor. In addition to the use of DataCamp, the group division is also intended for project work which will be discussed in the next week.